Navigation
Install the app
How to install the app on iOS
Follow along with the video below to see how to install our site as a web app on your home screen.
Note: This feature may not be available in some browsers.
More options
Style variation
Guest viewing limit reached
- You have reached the maximum number of guest views allowed
- Please register below to remove this limitation
- Already a member? Click here to login
You are using an out of date browser. It may not display this or other websites correctly.
You should upgrade or use an alternative browser.
You should upgrade or use an alternative browser.
Can touching a barbell in the gym get you sick with the coronavirus?
- Thread starter Michael Scally MD
- Start date
Using cellphone data from 1 in 3 Americans, researchers have identified the indoor public places most responsible for the spread of Covid-19 in the spring, and they argue that sharply limiting the occupancy of these locales — chiefly restaurants, gyms, cafes, hotels, and houses of worship — could control the raging pandemic without resorting to lockdowns.
Their analysis also explains how disparities in risk contribute to the disproportionate disease burden borne by people of color who have been less able than higher-income white people to work remotely and who tend to visit grocery stores and other places that tend to be smaller and more crowded than those in white neighborhoods. Mobility network models of COVID-19 explain inequities and inform reopening
Mining mobile phone data, scientists tracked 98 million people’s hourly movements from March 1 to May 2 to places they visited regularly, and then mapped their movements to nearly 533,000 locations onto models of infectious disease spread. The simulated transmission rates accurately predicted actual daily case counts in neighborhoods of 10 large metropolitan areas, including Chicago, New York City, and San Francisco. That allowed them to identify which “superspreader” venues pose the greatest risk, which socioeconomic factors matter, and what works to diminish the danger.
Rebecca Sussman got a coronavirus test because town officials in Bedford, N.Y., encouraged her to.
“If you haven’t gotten your test yet, please do so for yourself, your family and our community,” Chris Burdick, the town supervisor, said in an email. More tests would mean a lower positivity rate, he said, and a faster path to reopening. He directed residents to the town’s new testing site, situated on an empty parking lot at the train station.
Ms. Sussman, 51, took her whole family to get tested, and the results came back negative.
Then the paperwork came: $6,816 had been charged to insurance for four coronavirus tests. Ms. Sussman’s fees alone were $1,944.
She started looking through the itemized costs. One insurance claim showed that she had been tested for a dozen respiratory diseases. She found that odd; the town emails advertised only a coronavirus test. There was also a surprise $480 charge for a short phone call relaying her results.
“That’s when I realized something was wrong,” Ms. Sussman said. “When in the history of medical appointments does it ever cost to get a phone call giving you your test results?”
The bills didn’t come from the town. They came from Dr. Steven Murphy, an internist from Greenwich, Conn., whom Bedford had selected to run its testing site.
Ms. Sussman and 10 other patients contend that Dr. Murphy used this public testing site and others nearby to run unnecessary and expensive tests. He did so with little oversight from town officials, who had advertised his services widely.
During this pandemic, every activity in an indoor public place involves some level of risk, but some venues are far riskier than others—especially if they’re small and crowded.
We already knew that restaurants can easily become covid hot spots, but a new paper published in Nature today quantifies just how dangerous they really are: four times riskier than the next riskiest location, which was the gym. However, there could be a simple way to reduce the danger. Caps on the number of people permitted to be inside a restaurant simultaneously could cut infections drastically, according to a new model created by the team of epidemiologists, computer scientists, and social scientists from Stanford and Northwestern universities.
The researchers used smartphone data to predict where people were catching the coronavirus. They used data on the movements of almost 100 million people in the 10 biggest cities in the US from March 1 to May 1, 2020, provided by SafeGraph, a company that aggregates anonymized location data from smartphone apps. They collected the movements of people between their neighborhoods and points of interest like gyms, grocery stores, restaurants, or places of worship.
Then they used the smartphone data to predict infections on the basis of three metrics: how big the venue was, how long people stayed inside it, and how many people were likely to be infectious in the given area. Finally, they compared their model’s predicted number of infections with the official number of infections recorded in those neighborhoods over that same period. The new model was able to accurately predict actual cases, the team said.
The model was then used to simulate various scenarios: full-capacity reopening, caps at 50%, caps at 30%, and so on. Given that previous studies have found that 80% of new coronavirus cases are picked up at less than 20% of venues (so-called superspreader events), the researchers found that implementing occupancy caps could have a bigger impact than blanket lockdowns. And the businesses would lose only about 40% of the visits they could expect if they were fully open. By way of contrast, if restaurants in all 10 US cities were fully reopened, it would lead to about 6% of the entire population being infected, the model predicted.
After posting about sharply rising #COVID19 cases Friday, there were multiple replies to the effect of "but deaths aren't going up". As should be obvious to most at this point, (reported) deaths lag (reported) cases. This thread investigates. 1/8
There is a lag between when a case is diagnosed and when the individual may succumb to their disease and there is a further lag between date of death and when the death is reported. 2/8
Here, I compare state-level data from @COVID19Tracking for cases and deaths and find that a 22-day lag maximizes state-level correlations. 3/8
This can be seen across states where the solid lines show reported cases by date of report and dashed lines show reported deaths lagged by 22 days. You can see some detailed correspondences, especially in states experiencing the summer surge like Florida, Arizona and Texas. 4/8
Given this 22-day lag we can compute a lag-adjusted case fatality rate (CFR) by dividing reported deaths at day t by reported cases at day t - 22. This declines from ~6% in April, averaging 1.8% after August. 5/8
Looking backwards, this lag-adjusted CFR means that 991 deaths in the US today (with 7-day smoothing) should be compared against 57,206 cases reported Oct 19 (with 7-day smoothing). In this case, 991/57206 = 1.7% is consistent with this overall lag-adjusted CFR. 6/8
Or looking forwards, this lag-adjusted CFR suggests that 118,976 reported cases today (with 7-day smoothing) will translate to ~2150 deaths reported in 22 days on Dec 2. 7/8
I expect the US to be reporting over 2000 deaths per day in 3 weeks time. Importantly, this doesn't assume any further increases in circulation and is essentially "baked into" currently reported cases and represents conditions that take time to resolve and to be reported. 8/8
Thread by @trvrb on Thread Reader App
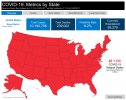
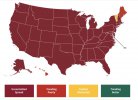
State Data and Policy Actions to Address Coronavirus
State Data and Policy Actions to Address Coronavirus


The Pfizer news means the value of avoiding infections over the next few months has gone way up. That in turn should make states more willing to move aggressively to reduce infections in the short term. The aim should be to get as many people through the winter as possible.
State Data and Policy Actions to Address Coronavirus


The Pfizer news means the value of avoiding infections over the next few months has gone way up. That in turn should make states more willing to move aggressively to reduce infections in the short term. The aim should be to get as many people through the winter as possible.
This Covid Surge Is America’s Longest—and It’s Getting Longer
Bloomberg - Are you a robot?
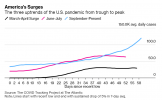
The American pandemic’s most sustained increase in Covid-19 infections appears poised to get even longer, a worrisome indicator for overworked doctors and nurses.
The nationwide uptick in cases that became noticeable around mid-September is now in its ninth week, counting from the previous low point in the seven-day average. That’s a longer run than the March-April tragedy that unfolded largely in the Northeast, and the June-July upswing that hit the Sun Belt hardest.
The new cases come as cold weather moves in, forcing many Americans indoors. The situation also has been compounded by pandemic fatigue, which makes public-health efforts such as masking and social distancing more challenging.

Another day, another promising COVID-19 vaccine? A Russian institute announced today its vaccine candidate has had remarkable success in an efficacy trial, just 2 days after the widely celebrated news from Pfizer and BioNTech that their vaccine had greater than 90% efficacy. The Russian report, however, is being met with raised eyebrows—and some outright guffaws.
In a press release, the Gamaleya National Center of Epidemiology and Microbiology in Moscow said an interim analysis of a large-scale trial underway in Russia https://www.sciencemag.org/sites/default/files/The%20first%20interim%20data%20analysis%20of%20the%20Sputnik%20V%20vaccine%20against%20COVID-19%20phase%20III%20clinical%20trials%20in%20the%20Russian%20Federation%20demonstrated%2092%25%20efficacy%20.pdf. The release quoted the Russian minister of health saying the results demonstrate that Sputnik V “is an efficient solution to stop the spread of coronavirus infection.” Yet it also noted the review covered just 20 total COVID-19 cases in the vaccinated and placebo groups—far too few for the claim be convincing, experts inside and outside of Russia say.
[OA] Sex Differences In COVID-19: The Role of Androgens in Disease Severity and Progression.
Purpose: Throughout the SARS-CoV2 pandemic, multiple reports show higher percentages of hospitalization, morbidity, and mortality among men than women, indicating that men are more affected by COVID-19. The pathophysiology of this difference is yet not established, but recent studies suggest that sex hormones may influence the viral infectivity process. Here, we review the current evidence of androgen sensitivity as a decisive factor for COVID-19 disease severity.
Methods: Relevant literature investigating the role of androgens in COVID-19 was assessed. Further, we describe several drugs suggested as beneficial for COVID-19 treatment related to androgen pathways. Lastly, we looked at androgen sensitivity as a predictor for COVID-19 progression and ongoing clinical trials on androgen suppression therapies as a line of treatment.
Results: SARS-COV2 virus spike proteins utilize Transmembrane protease serine 2 (TMPRSS2) for host entry. Androgen receptors are transcription promoters for TMPRSS2 and can, therefore, facilitate SARS-COV2 entry. Variants in the androgen receptor gene correlate with androgen sensitivity and are implicated in diseases like androgenetic alopecia and prostate cancer, conditions that have been associated with worse COVID-19 outcomes and hospitalization.
Conclusion: Androgen's TMPRSS2-mediated actions might explain both the low fatalities observed in prepubertal children and the differences between sexes regarding SARS-COV2 infection. Androgen sensitivity may be a critical factor in determining COVID-19 disease severity, and sensitivity tests can, therefore, help in predicting patient outcomes.
Mohamed MS, Moulin TC, Schiöth HB. Sex differences in COVID-19: the role of androgens in disease severity and progression. Endocrine. 2020 Nov 11. doi: 10.1007/s12020-020-02536-6. Epub ahead of print. PMID: 33179220. Sex differences in COVID-19: the role of androgens in disease severity and progression
Similar threads
- Replies
- 59
- Views
- 1K

