Climate Change

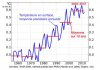
Sea Surface Temperatures Along U.S. East Coast Highest In 150 Years During 2012

The warmest year on record for the continental U.S. also brought the warmest recorded sea surface temperatures in 150 years for the East Coast between Cape Hatteras, N.C. and the Gulf of Maine.

Using satellite and ship-board measurements, NOAA's Northeast Fisheries Science Center (NEFSC) reported that average surface temperatures reached 57.2 F (14 C) in 2012, beating the previous record set in 1951. 2012's temperature rise also marked the largest single-year increase since records began in 1854 and one of only five times that average temperatures have jumped by more than 1.8 F (1 C).

NOAA: 2012 Hottest & 2nd-Most Extreme Year On Record | Climate Central

It’s official: 2012 was the warmest year on record in the lower 48 states, as the country experienced blistering spring and summer heat, tinderbox fire weather conditions amid a widespread drought, and one of the worst storms to ever strike the Mid-Atlantic and Northeast.

According to the National Oceanic and Atmospheric Administration (NOAA), 2012 had an average temperature of 55.3°F, which eclipsed 1998, the previous record holder, by 1°F. That was just off Climate Central’s calculation in mid-December, which projected an expected value of 55.34°F, based on historical data.

The 1°F difference from 1998 is an unusually large margin, considering that annual temperature records are typically broken by just tenths of a degree Fahrenheit. In fact, the entire range between the coldest year on record, which occurred in 1917, and the previous record warm year of 1998 was just 4.2°F.

The year consisted of the fourth-warmest winter, the warmest spring, second-warmest summer, and a warmer-than-average fall. With an average temperature that was 3.6°F above average, July became the hottest month ever recorded in the contiguous U.S. The average springtime temperature in the lower 48 was so far above the 1901-2000 average — 5.2°F, to be exact — that the country set a record for the largest temperature departure for any season on record.

"Climate change has had a role in this [record],” said Jake Crouch, a climate scientist at NOAA's National Climatic Data Center in Asheville, N.C. He said it isn't clear yet exactly how much of the temperature record was due to climate change compared to natural variability, but that it's unlikely such a record would have occurred without the long-term warming trend caused in large part by emissions of greenhouse gases.

During the summer, nearly 100 million people experienced 10 or more days with temperatures greater than 100°F, which is about one-third of the nation’s population, NOAA reported.

With 34,008 daily high temperature records set or tied the year compared to just 6,664 daily record lows — a ratio of about five high temperature records for every one low temperature record — 2012 was no ordinary weather year in the U.S. It wasn’t just the high temperatures that set records, though. Overnight low temperatures were also extremely warm, and in a few cases the overnight low was so warm that it set a high temperature record, a rare feat.

SS13.04 Spring Ecosystem Advisory: Sea Surface Temperatures Reach Highest Level in 150 Years on Northeast Continental Shelf

Ecosystem AdvisoryFor the Northeast Shelf Large Marine Ecosystem - Spring 2013


Sea Surface Temperature | Climate Change | US EPA

Summary of Conditions of the Northeast Shelf Ecosystem

Sea surface temperatures (SSTs) in the Northeast Shelf Large Marine Ecosystem during 2012 were the highest ever recorded in both long-term observational and short-term remote sensing time series. These exceptionally high SSTs are part of a pattern of elevated temperatures occurring in the Northwest Atlantic, but not seen elsewhere in the ocean basin.

The fall bloom on the Northeast Shelf was poorly developed with the exception of some bloom activity in the eastern Gulf of Maine; resources dependent on the fall bloom will experience a deficit in energy flow.

Chlorophyll concentration over the course of the year 2012 remained high compared to recent years despite low fall chlorophyll. The relatively high biomass level can be attributed to the above average 2012 spring bloom.

Reflecting the large jump in temperature of the ecosystem, Northeast Shelf warm water thermal habitat was at a record high level during 2012, whereas cold water habitat was at a record low level.

Winter mixing went to extreme depths in 2013, which will impact the spring bloom by redistributing nutrients and affecting the stratification of the water column as the bloom develops.
 
Dredd Blog: All Weather is Local - 4

Are you noticing record breaking cold weather in some southern states such as Texas, record snow in other states such as Arkansas, even as 95 degree temperatures with hot wild fires are burning in California at the same time?

Do you also remember the past two years when the Army Corps of Engineers was dynamiting levees in the Midwest along the Mississippi River to avoid catastrophic flooding further down river?

"The U.S. Army Corps of Engineers used dynamite to blast open the levee in three locations on May 2 [2011] to relieve flooding in Cairo, IL. As a result, about 200 square miles of fertile farmland was flooded".

Do you also remember that the very next year, 2012, the water level in the same Mississippi River became so low that commercial barge traffic was impaired?

"The worst drought in half a century has brought water levels in the Mississippi close to historic lows and could shut down all shipping ... the second extreme event on the river in 18 months, after flooding in the spring of 2011".

So, one year they are bombing the levees along the banks that restrain the river, but the next year they are bombing the bottom of the river to try to make it deeper.

One year has dangerously high water levels, the next year has dangerously low water levels.

In this Dredd Blog series that links to related posts from time to time (e.g. Parochial Climate & Parochial Mentality) we have been discussing how merely analyzing local weather is not the way to determine whether or not there has been damage to a Global Climate System.

No, the proper way to use local weather in climate system analysis is to notice the global perspective in the global climate system and the "local weather" of other places around the globe.

"Out of sight, out of mind" is a dangerous way to analyze the impact that damage to the global climate system has worldwide:

America’s top military officer in charge of monitoring hostile actions by North Korea, escalating tensions between China and Japan, and a spike in computer attacks traced to China provides an unexpected answer when asked what is the biggest long-term security threat in the Pacific region: climate change.

Navy Admiral Samuel J. Locklear III, in an interview at a Cambridge hotel Friday after he met with scholars at Harvard and Tufts universities, said significant upheaval related to the warming planet “is probably the most likely thing that is going to happen ... that will cripple the security environment, probably more likely than the other scenarios we all often talk about.’’


An Admiral in the Pentagon heads up the Navy's global planning strategy understands the same vision:

This Navy Admiral even believes that Singapore will no longer be the greatest ocean port, but that a port in Greenland will take that honor, because after the polar ice caps melt in the Arctic, the fabled Northwest Passage will become strategic, and the Panama Canal will become somewhat of a museum piece.
 
Valley Fever Hits Thousands In Parched Central Valley

California and federal public health officials say valley fever, a potentially lethal disease, has been on the rise as warming climates and drought have kicked up the dust that spreads it.

The disease can be contracted by simply breathing in fungus-laced spores from dust disturbed by wind as well as human or animal activity.

Data shows the number of valley fever cases rose by more than 850 percent nationwide over the past 13 years, with most cases reported in California and Arizona.

Experts say rainfall followed by hotter, drier weather makes more spores airborne, increasing the number of cases. Improved reporting methods and better diagnosis also partially explain the increase.

A federal health official last week ordered the transfer of more than 3,000 vulnerable inmates from two Central California prisons where several dozen have died of the disease.

California may have to move 3,000 inmates at risk for Valley fever | Fox News
 
Acidification: the Latest Unknown for Stressed Arctic Ecosystem
http://www.scientificamerican.com/article.cfm?id=acidification-the-latest-stress-for-Arctic
 
400 PPM: Carbon Dioxide in the Atmosphere Reaches Prehistoric Levels
400 PPM: Carbon Dioxide in the Atmosphere Reaches Prehistoric Levels | Observations, Scientific American Blog Network

On May 2, after nightfall shut down photosynthesis for the day in Hawaii, carbon dioxide levels in the atmosphere touched 400 parts-per-million there for the first time in at least 800,000 years. Near the summit of volcanic Mauna Loa—where a member of the Keeling family has kept watch since 1958—sensors measured this record through sunrise the following day. Levels have continued to dance near that benchmark in recent days, registering above 400 ppm for the first time in eons after midnight on May 7. When the measurements started the daily average could be as low as 315 ppm, already up from a pre-industrial average of around 280 ppm.
 
http://www.nytimes.com/2013/05/11/s...vel-passes-long-feared-milestone.html?hp&_r=0
Indirect measurements suggest that the last time the carbon dioxide level was this high was at least three million years ago, during an epoch called the Pliocene. Geological research shows that the climate then was far warmer than today, the world’s ice caps were smaller, and the sea level might have been as much as 60 or 80 feet higher.

Experts fear that humanity may be precipitating a return to such conditions — except this time, billions of people are in harm’s way.

“It takes a long time to melt ice, but we’re doing it,” Dr. Keeling said. “It’s scary.”

Countries have adopted an official target to limit the damage from global warming, which by most estimates requires that emissions stop by the time the level reaches about 450. “Unless things slow down, we’ll probably get there in well under 25 years,” Ralph Keeling said.

The Keeling Curve | A daily record of atmospheric carbon dioxide from Scripps Institution of Oceanography at UC San Diego
A DAILY RECORD OF ATMOSPHERIC CARBON DIOXIDE FROM SCRIPPS INSTITUTION OF OCEANOGRAPHY AT UC SAN DIEGO

Latest reading: 399.73 ppm
CO2 concentration on May 9, 2013

Special note on May 9, 2013 reading
May 10, 2013
May 10 Comment: NOAA has reported 400.03 for yesterday, but Scripps has reported 399.73. The difference is similar to other differences we have reported. The difference partly reflects time zone differences. NOAA uses UTC, whereas we use local time in Hawaii to define the start and stop of a given day. Changing to UTC excludes the lower co2 period from the baseline on the May 9, shifting it to May 10.

The remaining baseline data then averages 400.08 for May 9.

Trends in Carbon Dioxide
Trends in Atmospheric Carbon Dioxide

Trends in Carbon Dioxide
Time history of atmospheric carbon dioxide from 800,000 years ago until January, 2012.

Scripps CO2 Program - Home
CO2 Concentration at Mauna Loa Observatory, Hawaii
 
http://www.nytimes.com/2013/05/14/s...-carbon-dioxide-mean-for-climate.html?hp&_r=0

Since 1896, scientists have been trying to answer a deceptively simple question: What will happen to the temperature of the earth if the amount of carbon dioxide in the atmosphere doubles?

Some recent scientific papers have made a splash by claiming that the answer might not be as bad as previously feared. This work — if it holds up — offers the tantalizing possibility that climate change might be slow and limited enough that human society could adapt to it without major trauma.

Several scientists say they see reasons to doubt that these lowball estimates will in fact stand up to critical scrutiny, and a wave of papers offering counterarguments is already in the works. “The story is not over,” said Chris E. Forest, a climate expert at Pennsylvania State University.

Still, the recent body of evidence — and the political use that climate contrarians are making of it to claim that everything is fine — sheds some light on where we are in our scientific and public understanding of the risks of climate change.

The topic under discussion is a number called “climate sensitivity.” Finding this number is the holy grail of climate science, because the stakes are so high: The fate of the earth hangs in the balance.


The first to take a serious stab at it was a Swede named Svante Arrhenius, in the late 19th century. After laborious calculations, he declared that if humans doubled the carbon dioxide in the air by burning fossil fuels, the average temperature of the earth would rise by something like nine degrees Fahrenheit, a whopping figure.

He was on the high side, as it turned out. In 1979, after two decades of meticulous measurements had made it clear that the carbon dioxide level was indeed rising, scientists used computers and a much deeper understanding of the climate to calculate a likely range of warming. They found that the response to a doubling of carbon dioxide would not be much below three degrees Fahrenheit, nor was it likely to exceed eight degrees.

In the years since, scientists have been pushing and pulling within that range, trying to settle on a most likely value. Most of those who are expert in climatology subscribe to a best-estimate figure of just over five degrees Fahrenheit.

That may not sound like a particularly scary number to many people — after all, we experience temperature variations of 20 or 30 degrees in a single day. But as an average for the entire planet, five degrees is a huge number.

The ocean, covering 70 percent of the surface, helps bring down the average, but the warming is expected to be higher over land, causing weather extremes like heat waves and torrential rains. And the poles will warm even more, so that the increase in the Arctic could exceed 10 or 15 degrees Fahrenheit. That could cause substantial melting of the polar ice sheets, ultimately flooding the world’s major coastal cities.

What’s new is that several recent papers have offered best estimates for climate sensitivity that are below four degrees Fahrenheit, rather than the previous best estimate of just above five degrees, and they have also suggested that the highest estimates are pretty implausible.

Notice that these recent calculations fall well within the long-accepted range — just on the lower end of it. But the papers have caused considerable excitement among climate-change contrarians.

It is not that they actually agree with the new numbers, mind you. They have long pushed implausibly low estimates of climate sensitivity, below two degrees Fahrenheit in some cases. But they appear to be calculating that any paper with a lowball number is a step in their direction.

James Annan, a mainstream climate scientist working at a Japanese institute, offers a best estimate of four and a half degrees Fahrenheit. When he wrote recently that he thought some of the highest temperature projections could be rejected, skeptics could not contain their enthusiasm.

“That is what we call a landmark change of course — by one of climatology’s most renowned warmist scientists,” declared a blogger named Pierre L. Gosselin. “If even Annan can see it, then the writing is truly emblazoned on the wall.”


But does this sort of claim — that we can all breathe a sigh of relief about climate change — really hold up?

Dr. Annan said in an e-mail that the Intergovernmental Panel on Climate Change, a mainstream body that periodically summarizes climate science, should be bolder about ruling out extreme temperature scenarios, but he still believes global warming is a sufficient threat to warrant changes in human behavior.

He noted that climate skeptics “are desperate to claim that the I.P.C.C. is being unreasonably alarmist, but on the other hand they don’t really want to agree with me either, because my views are close enough to the mainstream as to be unacceptable to them.” He added that he finds it “amusing to watch their gyrations as they try to square the circle.”

It will certainly be good news if these recent papers stand up to critical scrutiny, something that will take at least a year or two to figure out. But the need for additional scientific vetting before we accept the lower numbers is not the biggest flaw in the contrarian argument.

Remember, the climate sensitivity number, whatever it turns out to be, applies to a doubling of carbon dioxide.

Given how weak the political response to climate change has been, there is no reason to think that human society is going to stop there. Some experts think the level of the heat-trapping gas could triple or even quadruple before emissions are reined in. Only last week the level of carbon dioxide passed a milestone of 400 parts per million at the flagship monitoring station atop Mauna Loa, in Hawaii, evidence that efforts to control emissions are failing.

Even if climate sensitivity turns out to be on the low end of the range, total emissions may wind up being so excessive as to drive the earth toward dangerous temperature increases.

So if the recent science stands up to critical examination, it could indeed turn into a ray of hope — but only if it is then followed by a broad new push to get the combustion of fossil fuels under control.

RealClimate: On sensitivity: Part I

RealClimate: Start here
 
This is how it ends and begins. Its the cycle of human existence. We will probably
not be here for the rebirth, but with luck we may see the death. The ancestors of those who survive will come out of the darkness of ignorance to once again have curiosity. Whats on the other side of the mountain? Across the sea? If a bird can fly why not me? Now that we can fly can we put a man on the moon?
By our hand or the hand of nature, the prophecy will come to pass. To all things there is a season. Our season is about to pass.
So double your mgs. It will be another 8000 years before they rediscover gear.[:o)]
 
The Last Time Atmospheric CO2 was at 400 parts per million Humans Didn’t Exist – Significant Figures by Peter Gleick

The last time atmospheric CO2 was at 400 parts per million was during the ancient Pliocene Era, three to five million years ago, and humans didn’t exist.

Global average temperatures were 3 to 4 degrees C warmer than today (5.4 to 7.2 degrees F).

Polar temperatures were as much as 10 degrees C warmer than today (18 degrees F).

The Arctic was ice free.

Sea level was between five and 40 meters higher (16 to 130 feet) than today.

Coral reefs suffered mass die-offs.

And much more: As Robert Monroe notes: “The extreme speed at which carbon dioxide concentrations are increasing is unprecedented. An increase of 10 parts per million might have needed 1,000 years or more to come to pass during ancient climate change events. Now the planet is poised to reach the 1,000 ppm level in only 100 years if emissions trajectories remain at their present level.”

The Keeling Curve | What Does 400 ppm Look Like?

The Pliocene is the geologic era between five million and three million years ago. Scientists have come to regard it as the most recent period in history when the atmosphere’s heat-trapping ability was as it is now and thus as our guide for things to come.

Recent estimates suggest CO2 levels reached as much as 415 parts per million (ppm) during the Pliocene. With that came global average temperatures that eventually reached 3 or 4 degrees C (5.4-7.2 degrees F) higher than today’s and as much as 10 degrees C (18 degrees F) warmer at the poles. Sea level ranged between five and 40 meters (16 to 131 feet) higher than today.

As for what life was like then, scientists rely on fossil records to recreate where plants and animals lived and in what quantity. Pliocene fossil records show that the climate was generally warmer and wetter than today. Maps of Pliocene vegetation record forests growing on Ellesmere Island in the Canadian Arctic, and savannas and woodlands spreading over what is now North African desert. Both the Greenland and Antarctic ice sheets were smaller than today during the warmest parts of the Pliocene.

In the oceans, fossils mark the spread of tropical and subtropical marine life northward along the U.S. Eastern Seaboard. Both observations and models of the Pliocene Pacific Ocean show the existence of frequent, intense El Niño cycles—a climatic oscillation that today delivers heavy rainfall to the western U.S. causing both intense flooding but also increasing the river flows needed to sustain salmon runs. The absence of significant ocean upwelling in the warmest part of the Pliocene would have suppressed fisheries along the west coasts of the Americas, and deprived seabirds and marine mammals of food supplies. Reef corals suffered a major extinction during the peak of Pliocene warmth but reefs themselves did not disappear.

Richard Norris, a geologist at Scripps Institution of Oceanography, UC San Diego, said the concentration of CO2 is one means of comparison, but what is not comparable, and more significant, is the speed at which 400 ppm is being surpassed today.

“I think it is likely that all these ecosystem changes could recur, even though the time scales for the Pliocene warmth are different than the present,” Norris said. “The main lagging indicator is likely to be sea level just because it takes a long time to heat the ocean and a long time to melt ice. But our dumping of heat and CO2 into the ocean is like making investments in a pollution ‘bank,’ since we can put heat and CO2 in the ocean, but we will only extract the results (more sea-level rise from thermal expansion and more acidification) over the next several thousand years. And we cannot easily withdraw either the heat or the CO2 from the ocean if we actually get our act together and try to limit our industrial pollution–the ocean keeps what we put in it.”

Scientists can analyze the gases trapped in ice to reconstruct with high accuracy what climate was like in prehistory, but that record only goes back 800,000 years. It is trickier to estimate carbon dioxide levels before then, but in 2009, one research team reported finding evidence of carbon dioxide levels ranging between 365 and 415 ppm roughly 4.5 million years ago. They based their finding on the analysis of carbon isotopes present in compounds made by tiny marine phytoplankton preserved in ancient ocean sediments.

That estimate made Earth’s last experience of 400 ppm a much more recent event than scientists have commonly thought. There has been broader consensus that carbon dioxide concentrations have been much higher than today’s but not for tens of millions of years. The assertion that Earth passed the 400 ppm mark a mere 4.5 million years ago has been supported by other analyses, many of which also concluded that the temperatures at that time were higher than previously estimated. These studies suggest that the traditional way scientists currently rate Earth’s long-term sensitivity to extra doses of CO2 might not sufficiently take into account the slower effects of climate change on the sunlight-absorbing properties of the planet, such as ice sheet melt and changes in plant cover on land.

What that means is that Earth might react even more strongly to the increases in CO2 measured by the Keeling Curve. Several prominent questions remain to be answered, though, before accurate scenarios can be created. The extreme speed at which carbon dioxide concentrations are increasing is unprecedented. An increase of 10 parts per million might have needed 1,000 years or more to come to pass during ancient climate change events. Now the planet is poised to reach the 1,000 ppm level in only 100 years if emissions trajectories remain at their present level.

“Our grandchildren will inhabit a radically altered planet, as the ocean gradually warms up in response to the buildup of heat-trapping gases,” said Scripps Institution of Oceanography, UC San Diego geoscientist Jeff Severinghaus.

– Robert Monroe
 
Cook J, et al. Quantifying the consensus on anthropogenic global warming in the scientific literature. Environmental Research Letters 2013;8(2):024024. Quantifying the consensus on anthropogenic global warming in the scientific literature - IOPscience

We analyze the evolution of the scientific consensus on anthropogenic global warming (AGW) in the peer-reviewed scientific literature, examining 11?944 climate abstracts from 1991–2011 matching the topics 'global climate change' or 'global warming'. We find that 66.4% of abstracts expressed no position on AGW, 32.6% endorsed AGW, 0.7% rejected AGW and 0.3% were uncertain about the cause of global warming. Among abstracts expressing a position on AGW, 97.1% endorsed the consensus position that humans are causing global warming. In a second phase of this study, we invited authors to rate their own papers. Compared to abstract ratings, a smaller percentage of self-rated papers expressed no position on AGW (35.5%). Among self-rated papers expressing a position on AGW, 97.2% endorsed the consensus. For both abstract ratings and authors' self-ratings, the percentage of endorsements among papers expressing a position on AGW marginally increased over time. Our analysis indicates that the number of papers rejecting the consensus on AGW is a vanishingly small proportion of the published research.
 
Otto A, Otto FEL, Boucher O, et al. Energy budget constraints on climate response. Nature Geosci;advance online publication. http://www.nature.com/ngeo/journal/vaop/ncurrent/full/ngeo1836.html

The rate of global mean warming has been lower over the past decade than previously. It has been argued that this observation might require a downwards revision of estimates of equilibrium climate sensitivity, that is, the long-term (equilibrium) temperature response to a doubling of atmospheric CO2 concentrations. Using up-to-date data on radiative forcing, global mean surface temperature and total heat uptake in the Earth system, we find that the global energy budget implies a range of values for the equilibrium climate sensitivity that is in agreement with earlier estimates, within the limits of uncertainty. The energy budget of the most recent decade does, however, indicate a lower range of values for the more policy-relevant transient climate response (the temperature increase at the point of doubling of the atmospheric CO2 concentration following a linear ramp of increasing greenhouse gas forcing) than the range obtained by either analysing the energy budget of earlier decades or current climate model simulations.
 
http://www.nytimes.com/2013/05/30/w...unglues-mountains.html?hp&_r=0&pagewanted=all

GRINDELWALD, Switzerland — Marco Bomio recalls that bright Sunday morning in June 2006 as if it were yesterday. Mr. Bomio, 59, a school principal and mountain guide, attended a religious service on a high mountain meadow to mark the founding of a local guide group.

“Suddenly we saw this immense cloud,” he said over coffee in a wood chalet typical of this Alpine village. “Normally, it might have been snow. But in June?”

“Then we saw that it wasn’t snow,” he went on. “It was rock dust: part of the mountain had come down.”

Grindelwald, population 3,800, lies in the foothills of a wall of Alpine peaks, rising to more than 13,000 feet. It is also home to two of Switzerland’s largest glaciers, the Upper and Lower Grindelwald Glaciers, which for millenniums have snaked their way through Alpine gorges toward the town.

With global warming, the glaciers are melting. Once stretching to the edge of town, they now end high in the mountains. Moreover, their greenish glacial water is forming lakes. In summer, when the melting accelerates, floodwaters threaten the area. But the avalanche witnessed by Mr. Bomio shows that the shrinking of the glaciers removes a kind of buttress supporting parts of the mountains, menacing the region with rock slides.

Grindelwald stands as a stark example of what is happening these days to Switzerland’s glaciers, and there are more than a hundred, large and small. As the Lower Grindelwald Glacier shrank, its ice no longer buttressed the east wall of the Eiger, a 13,025-foot mountain that is part of the ring south of Grindelwald. Moreover, the warming reduces the effect of permafrost that once acted as a sort of glue binding together the mass of the mountains. On that day in 2006, a chunk of the Eiger amounting to about 900,000 cubic yards fell from the east face, causing the cloud of rock dust that startled Mr. Bomio and his friends.

Since 1997, Ruth Meier has run the Hotel Gletscherschlucht (the name means glacier gorge), with 6 rooms and 18 beds, at a point where water from the melting lower glacier runs out of a steep and narrow gorge. Well into the 20th century, the glacier extended clear through the gorge, which is about three-fifths of a mile long, and until about World War I, ice blocks were carved out of it for use in cooling in restaurants and kitchens as far afield as Paris. Where her hotel stands a field kitchen once fed the workmen who hacked the ice.

But now a large lake of melted glacial water has formed above the gorge. To avoid potential flooding that would threaten the village below, Ms. Meier said, a $15 million tunnel, more than a mile long, was completed in 2010 to channel excess water when the lake swells in the summer. Before that was done, she said, summer floodwaters regularly pushed gigantic ice blocks down the gorge.

“In July and August, it sounded like battle tanks coming down,” she said, sipping mineral water. “You could hear the stones rolling.” Floodwaters forced their way through the narrowest parts of the gorge, about 30 feet across, “like water gushing from a garden hose,” she said.

Why build a hotel at such a delicate spot? “To be at the pulse,” Ms. Meier answered. “We’re at the pulse of the eternal ice.”

Well, not so eternal any more. Over the past century or so, glaciers like those around Grindelwald have receded by about 650 feet, said Hans-Rudolf Keusen, a geologist whose company, Geotest, helped design the overflow tunnel. “Since 1980 it has been very rapid,” Mr. Keusen said. “In the last 30 years the average temperature in the Alps has risen by one and a half degrees.”

For Alpine towns like Grindelwald, the changes are challenging. As the glaciers recede, they leave masses of rock and sediment — moraines — on their edges. In 2011, rock and snow came down on the upper glacier, as sides of a mountain became unstable without the supporting pressure of the ice. A year before the Eiger collapsed, in 2005, a section of a high Alpine meadow fell, leaving a popular restaurant, the Stieregg, hanging precariously on the edge. Ms. Meier’s mother-in-law recalled herding sheep there as a girl.

Tourism long ago supplanted agriculture as the driver of the local economy. Every year, about 800,000 visitors from all over Europe, but also from America and increasingly Asia, board trains to climb from the town center to the Jungfraujoch, a saddle between two peaks over 13,000 feet known as “the top of Europe,” to enjoy the view.

The first tourists, English aristocrats, came in the 18th century. The first hotel opened in 1820; the first skiers came in 1891. Tourism now amounts to “more than 80 percent of the economy,” said Bruno Hauswirth, a marketing expert who manages the local tourism agency.

“It’s not just tourism; it’s a cross section,” he said. “Construction, financial services, retail.” Outside his office, backhoes were excavating for a $30 million shopping area in the village center.

Mr. Hauswirth, 45, who skied and taught skiing in North America, Japan and New Zealand before returning to his native Grindelwald, sees the changes in the mountains as an opportunity, not just as a threat. “You learn to live with it,” he said. The risks “are no more than in other areas of the Alps,” he said, adding, “People here are used to living with the mountains; it’s natural.”

Tour guides like Mr. Bomio are even profiting from the results of global warming, organizing “warming tours” to explain its effects using local developments as examples.

“Here you can visualize it; you can see it and feel it,”’ Mr. Hauswirth said. “You can see how we are reacting to it.”

The gorge overflow tunnel is not the only reaction. Hiking trails are being moved to avoid areas at risk, said Herbert Zurbrügg, Grindelwald’s town secretary. Across the mountains, Mr. Zurbrügg said, the authorities are installing radar devices to track movements in the landscape so that the few tourist destinations that are near glaciers, like campsites, can be evacuated if necessary.

“I think we can say we have the situation under control,” Mr. Zurbrügg said. “There is no fear.” Most measures taken, to control the flow of meltwater or to monitor regions surrounding the glaciers, are well outside the inhabited parts of town, he said.

“We are in a fortunate situation,” he said. He paused, then added, “Yet, you never know.”
 
11121


Température_2012
 

Attachments

  • GISStemp_10Yavg_UCL (1).jpg
    GISStemp_10Yavg_UCL (1).jpg
    20.3 KB · Views: 25
Goodbye, Miami
By century's end, rising sea levels will turn the nation's urban fantasyland into an American Atlantis. But long before the city is completely underwater, chaos will begin
http://www.rollingstone.com/politics/news/why-the-city-of-miami-is-doomed-to-drown-20130620
 
Harrison H. Schmitt and William Happer: In Defense of Carbon Dioxide
The demonized chemical compound is a boon to plant life and has little correlation with global temperature.
Harrison H. Schmitt and William Happer: In Defense of Carbon Dioxide - WSJ.com

Of all of the world's chemical compounds, none has a worse reputation than carbon dioxide. Thanks to the single-minded demonization of this natural and essential atmospheric gas by advocates of government control of energy production, the conventional wisdom about carbon dioxide is that it is a dangerous pollutant. That's simply not the case. Contrary to what some would have us believe, increased carbon dioxide in the atmosphere will benefit the increasing population on the planet by increasing agricultural productivity.
 
Back
Top